/
Usage Guide for 3 Dimensional Monthly Gadget
Usage Guide for 3 Dimensional Monthly Gadget
Introduction
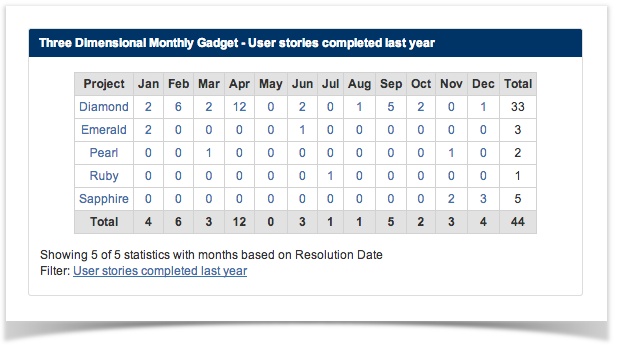
The Three Dimensional Monthly Gadget allows you to display the selected statistics grouped by month.
In addition, it supports
- grouping by year
- summing up totals for rows and columns
- clickable links to zoom into the issues matching the statistics
Usage
To present the information in the Three Dimensional Monthly Gadget,
- Define and save the Jira filters
- Insert the Three Dimensional Monthly Gadget on the dashboard
- Configure the user preferences for the gadget
Define and save the JIRA filters
Please refer to Jira Documentation (Using filters) on how to create a filter
You can use the advanced JQL functions like startOfYear() and endOfYear() to limit the results of the filter to the current year
Inserting Three Dimensional Monthly Gadget on the dashboard
To add a Three Dimensional Monthly Gadget on the dashboard,
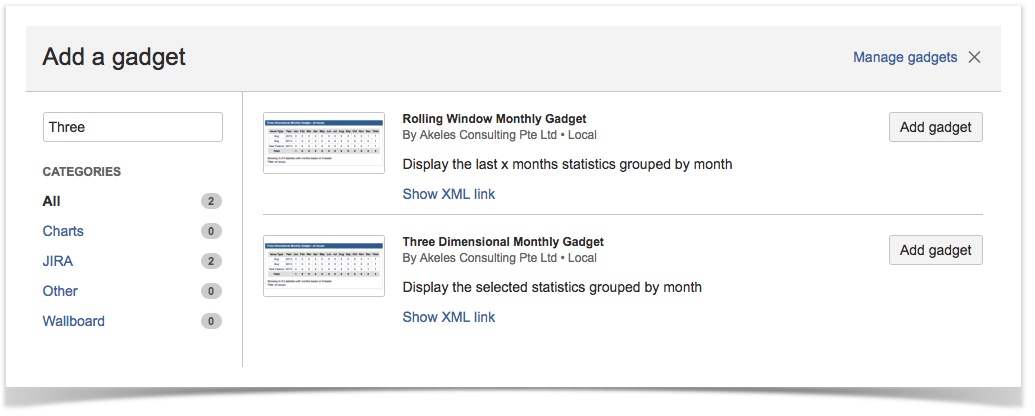
- Click on Add Gadget button on the Dashboard view to add a new gadget
- The Gadget Directory will pop up
- Enter "Three" in the search box to filter the matching gadget
- Click on the Add Gadget button to add the
- Repeat step 4 for each additional gadget required
- Click on the Finished button to return back to the Dashboard
Configure the user preferences for the gadget
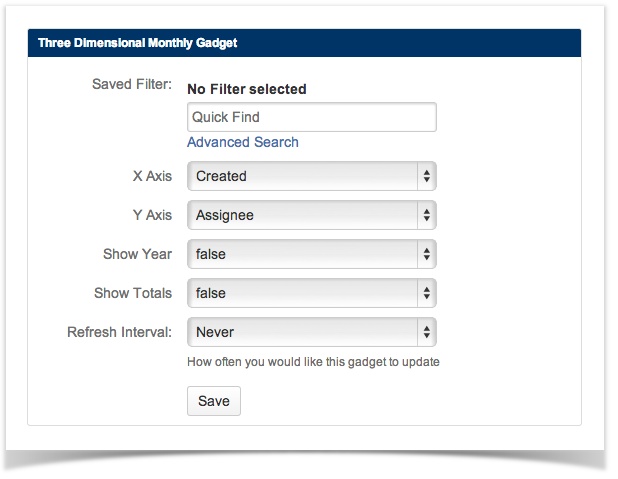
Fill in the preferences
PreferenceDescriptionNotesSaved Filter The filter for searching the issue X Axis The date field to be used for segmenting the issues across the months in the year Y Axis The issue field to be used for dividing the issues into different category rows Show Year Whether to display the year in the table Possible values are true or false
If show year is selected false and the matching issues lapse across multiple years, the clickable links will be disabledShow Totals Whether to sum the totals Possible values are true or false Refresh Interval how often you want the gadget to update itself - Click on the Save button to save the changes
, multiple selections available,
Related content
Usage Guide for 3 Dimensional Monthly Gadget (Lite)
Usage Guide for 3 Dimensional Monthly Gadget (Lite)
More like this
Configuring Three Dimensional Monthly Gadget
Configuring Three Dimensional Monthly Gadget
More like this
3D Gadgets 1.4.0 Release Notes
3D Gadgets 1.4.0 Release Notes
More like this
Usage Guide for Rolling Window Monthly Gadget
Usage Guide for Rolling Window Monthly Gadget
More like this
Three Dimensional Date Gadgets for Jira Cloud
Three Dimensional Date Gadgets for Jira Cloud
More like this
Configuring Rolling Window Monthly Gadget
Configuring Rolling Window Monthly Gadget
More like this


