
How to Configure Multiple Filters Line Chart Gadget 1.x
- Angela Teo
Owned by Angela Teo
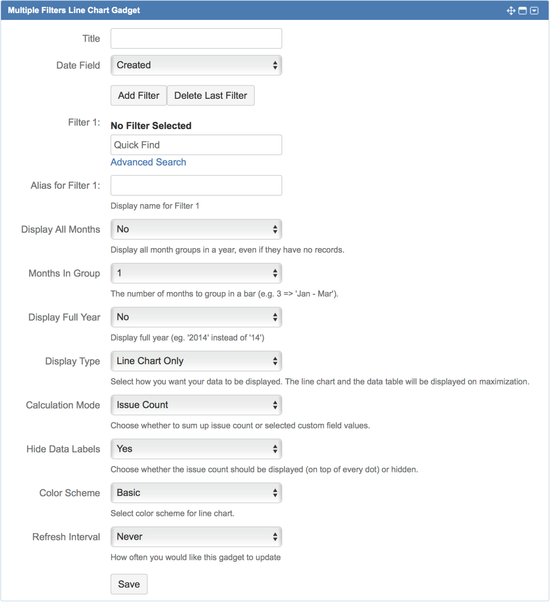
| Settings | Default | Description |
|---|---|---|
| Title | Enter title for the gadget. | |
| Date Field | Created | Select the date field to plot as the x-axis of the line chart:
|
Add Filter | Maximum of 12 filters can be added from version 1.4.0 onwards. Click to add another filter. | |
Delete Last Filter | Click to delete the last filter. | |
| Filter n | Choose the filter(s) to plot the line chart. | |
| Alias for Filter n | Define an alias for the filter(s) to be displayed in the legend. If undefined, filter name will be displayed. | |
| Display All Months | No | Select whether to display all months in the chart regardless of the value:
|
| Months In Group | 1 | Select the number of months to be grouped together:
E.g. 4 months in group: Jan ― Apr, May ― Aug, Sep ― Dec. |
| Display Full Year | No | Select whether to display the full year:
|
| Display Type | Line Chart Only | Select the display type of the gadget:
|
| Calculation Mode | Issue Count | Select the calculation mode of the filters:
|
| Hide Data Labels | Yes | Select whether to hide the values:
|
| Color Scheme | Basic | Select a color scheme for the line chart:
|