Introduction
In order to determine whether it is a client side error caused by the browser or a server side error, we can use the Chrome Javascript console to inspect for any error messages
Steps
- Log in to the application (e.g. Confluence/JIRA) with a Google Chrome browser
- Open a dedicated Console panel with the keyboard shortcut
- Windows / Linux: Ctrl+Shift+J
- Mac: Cmd+Opt+J
- If the Console tab is not selected, click on the Console
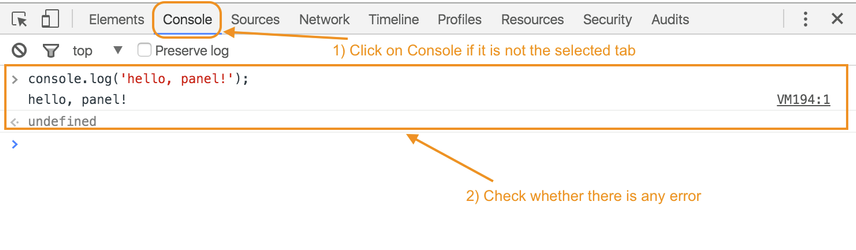
- Try to repeat the steps leading to the error
- Check the console tab for any error messages
- Please provide us a screenshot of the output