...
...
...
...
...
...
Configuration
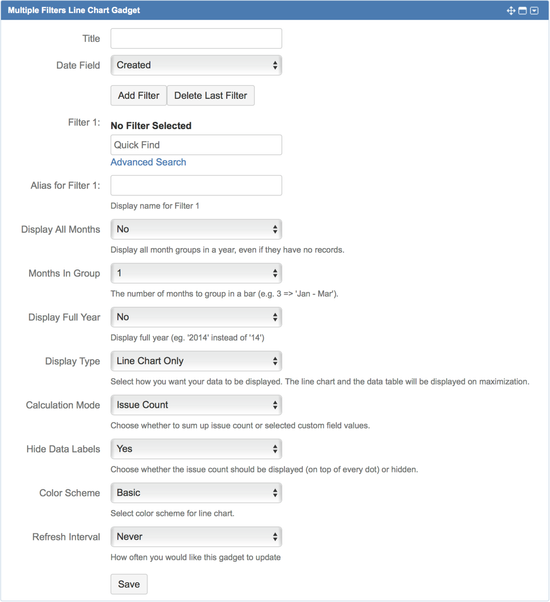
| Settings | Default Value | Explanation |
|---|---|---|
| Title | Enter title for the line chart window. | |
| Date Field | Created | Select the Issue Field (of Date Type) to plot as the X-axis of the line chart. |
Add Filter | Click to add another filter. | |
Delete Last Filter | Click to delete the last filter. | |
| Filter n (max. 12) | Choose the filter(s) that you want to display in the line chart. | |
| Alias for Filter n | Define an alias for the filter(s) to be displayed in the legend. If undefined, filter name will be displayed. | |
| Display All Months | No | Choose whether to display all months in the chart regardless of the value (no. of records/issues):
|
| Months In Group | 1 | Choose the number of months to be grouped together:
E.g. If 4 is chosen, grouping will be: Jan ― Apr, May ― Aug, Sep ― Dec. |
| Display Full Year | No | Choose the display format of the Year:
|
| Display Type | Line Chart Only | Choose the display type of the gadget:
|
| Calculation Mode | Issue Count | Choose whether to display the sum of issue count or selected custom field values:
|
| Hide Data Labels | Yes | Choose whether to display or hide the value:
|
| Color Scheme | Basic | Choose a color scheme:
|
| Refresh Interval | Never | Select how often (how many minutes interval) the line chart should be refreshed:
|
...