
Release Notes for 2.0.0
- Angela Teo
- Stella
- Hua Soon SIM [Akeles]
Summary
This is a major release with a lot of new features. We hope you will like it too.
- Calculation with Different Fields
- More Calculation Modes - Average, Minimum, Maximum
- Reusing of Filters
- Support for Time Fields
Support for Negative Values in Charts
New features
1. Calculation with Different Fields
It is possible to specify a different field for each filter. This gives the possibility for more powerful/flexible reporting.
For example: It is possible to tabulate with 3 different fields within a single table (issue count, story point and time spent)
| Filter | Jan - Mar 17 | Apr - Jun 17 | Jul - Sep 17 | Oct - Dec 17 |
|---|---|---|---|---|
| No. of issues completed | 15 | 20 | 7 | 0 |
| Sum of story points | 360 | 370 | 100 | 0 |
| Sum of time spent (w) | 24 | 25 | 15 | 0 |
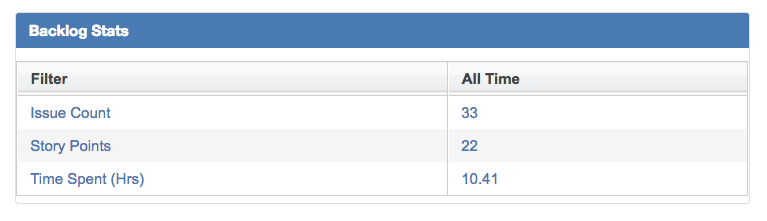
or find out the statistics on the backlog
2. More Calculation Modes - Average, Minimum, Maximum
In the previous release, we have introduced the Sum calculation mode. This version, we have added more calculation modes
The calculation mode are now split into 2 select fields.
- Select the issue count or issue field to calculate.
- Select the calculation operator. (Sum/Average/Minimum/Maximum)
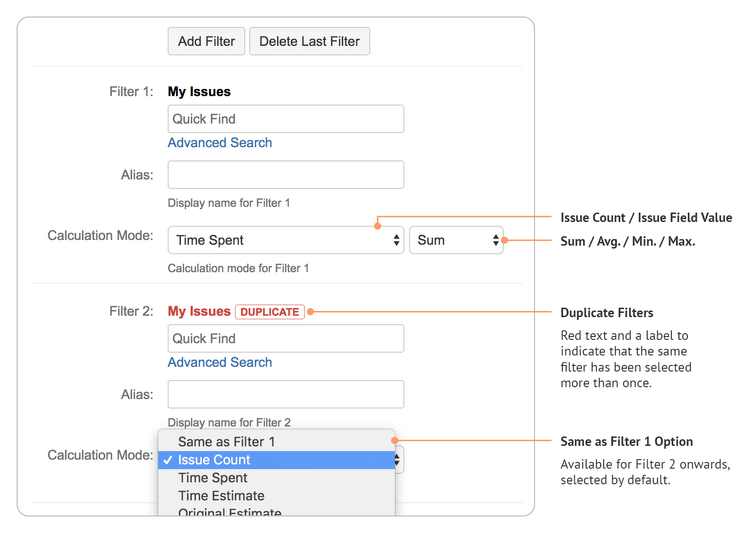
From Filter 2 onwards, there is also an option of 'Same as Filter 1', which will be selected by default when a new filter is added.
3. Reusing of Filters
With the 2 new features, users might want to chart different fields for the same filter.
You can now choose a filter that has been previously selected. It will be highlighted as Duplicate to highlight it has been selected more than once.
4. Support for Time Fields
Calculation of the following time tracking fields are now supported.
- Time Spent
- Time Estimate
- Time Original Estimate
Calculating time
An additional preference 'Display Time In' has been added. Users can choose to display the time in:
- Hours
- Days
- Weeks
For the conversion, the number of hours per day and number of days per week will follow Jira's time tracking properties (number of working hours per day and number of working days per week).
![]()
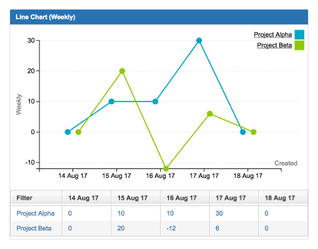
5. Support for Negative Values in Charts
It is possible to chart fields with negative values now
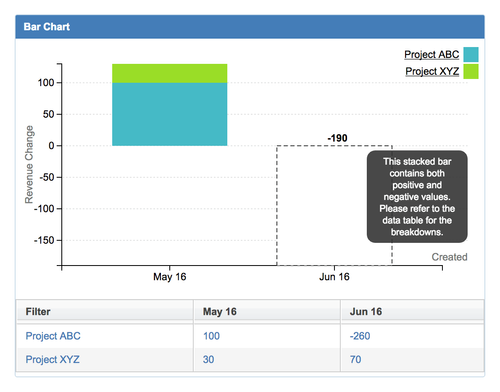
Bar Chart (Stacked)
If a stacked bar contains both positive and negative values, the bar will display the final value after subtracting the negative values.
Users can refer to the data table for the breakdowns.
Bar Chart (Grouped) / Line Chart
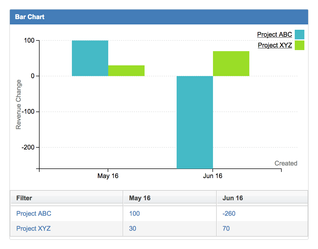
Line Chart
If you like the features, please give us a review at the plugin listing. Thanks ![]()