- Select the Dashboard that you wish to add the gadget in.
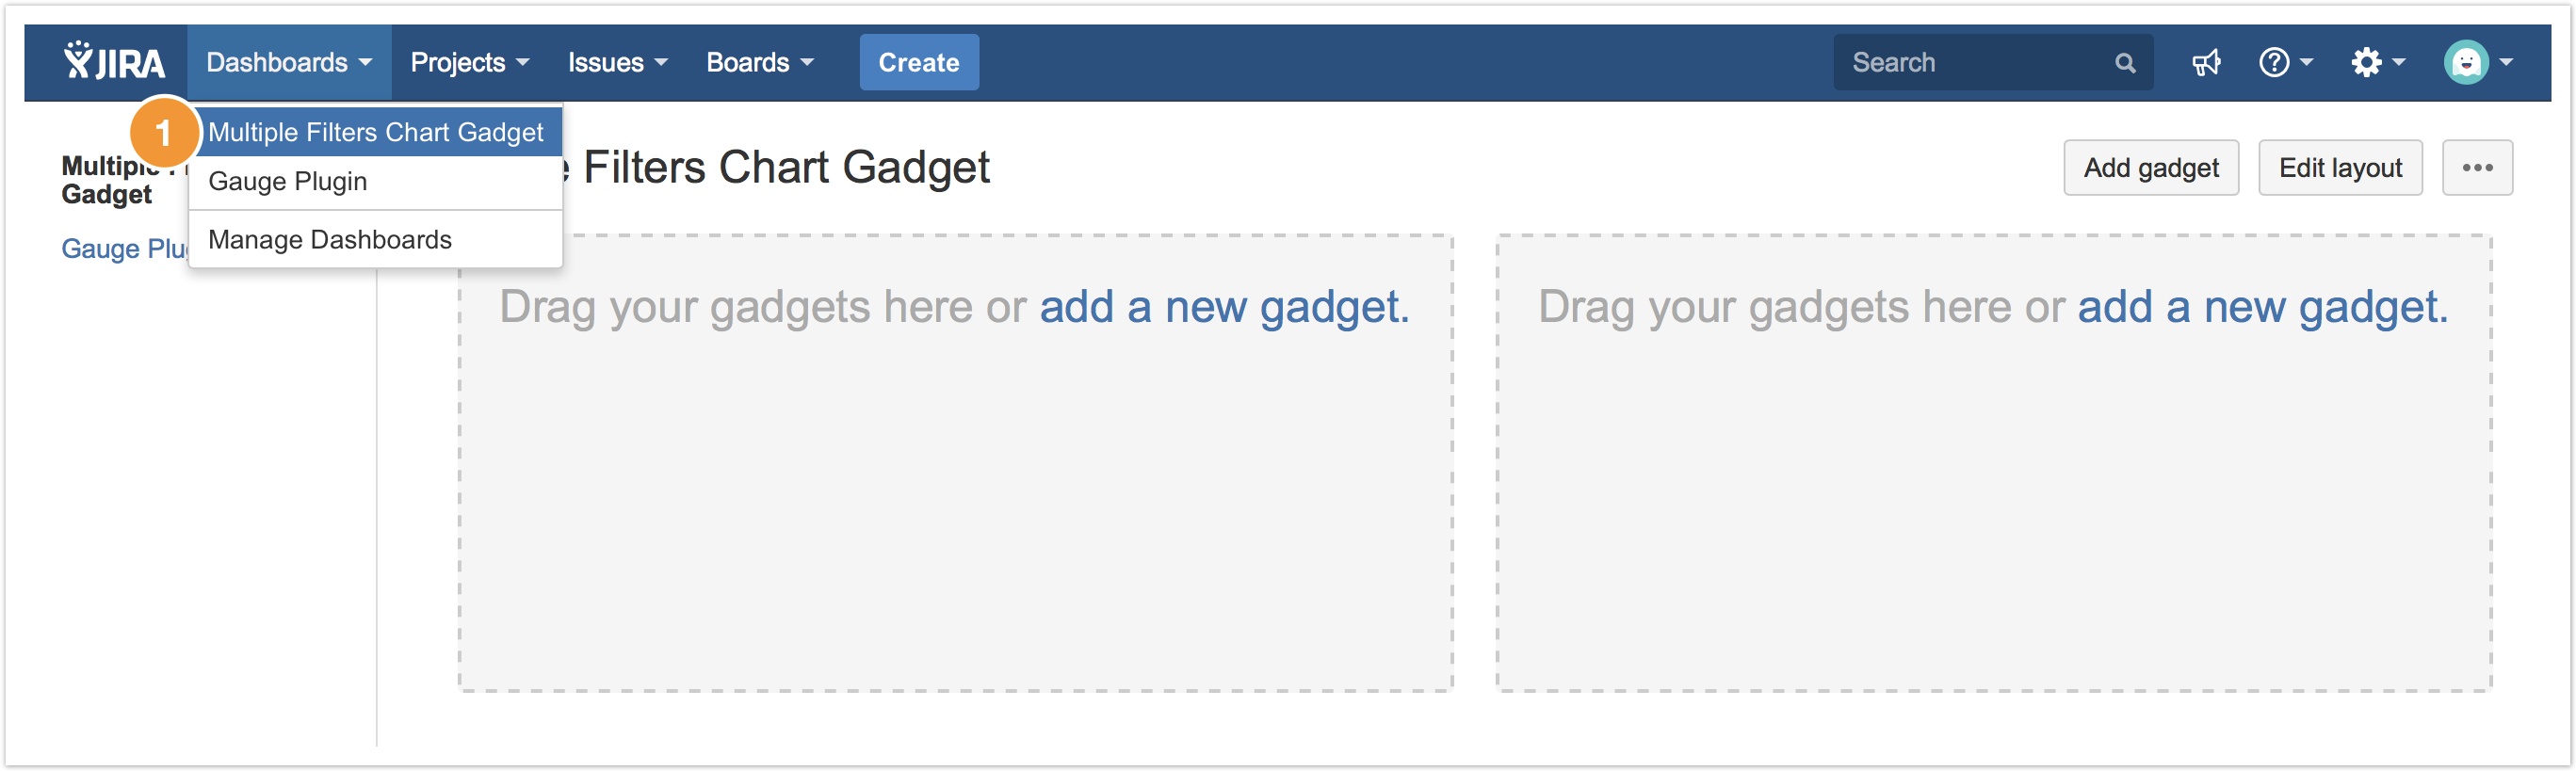
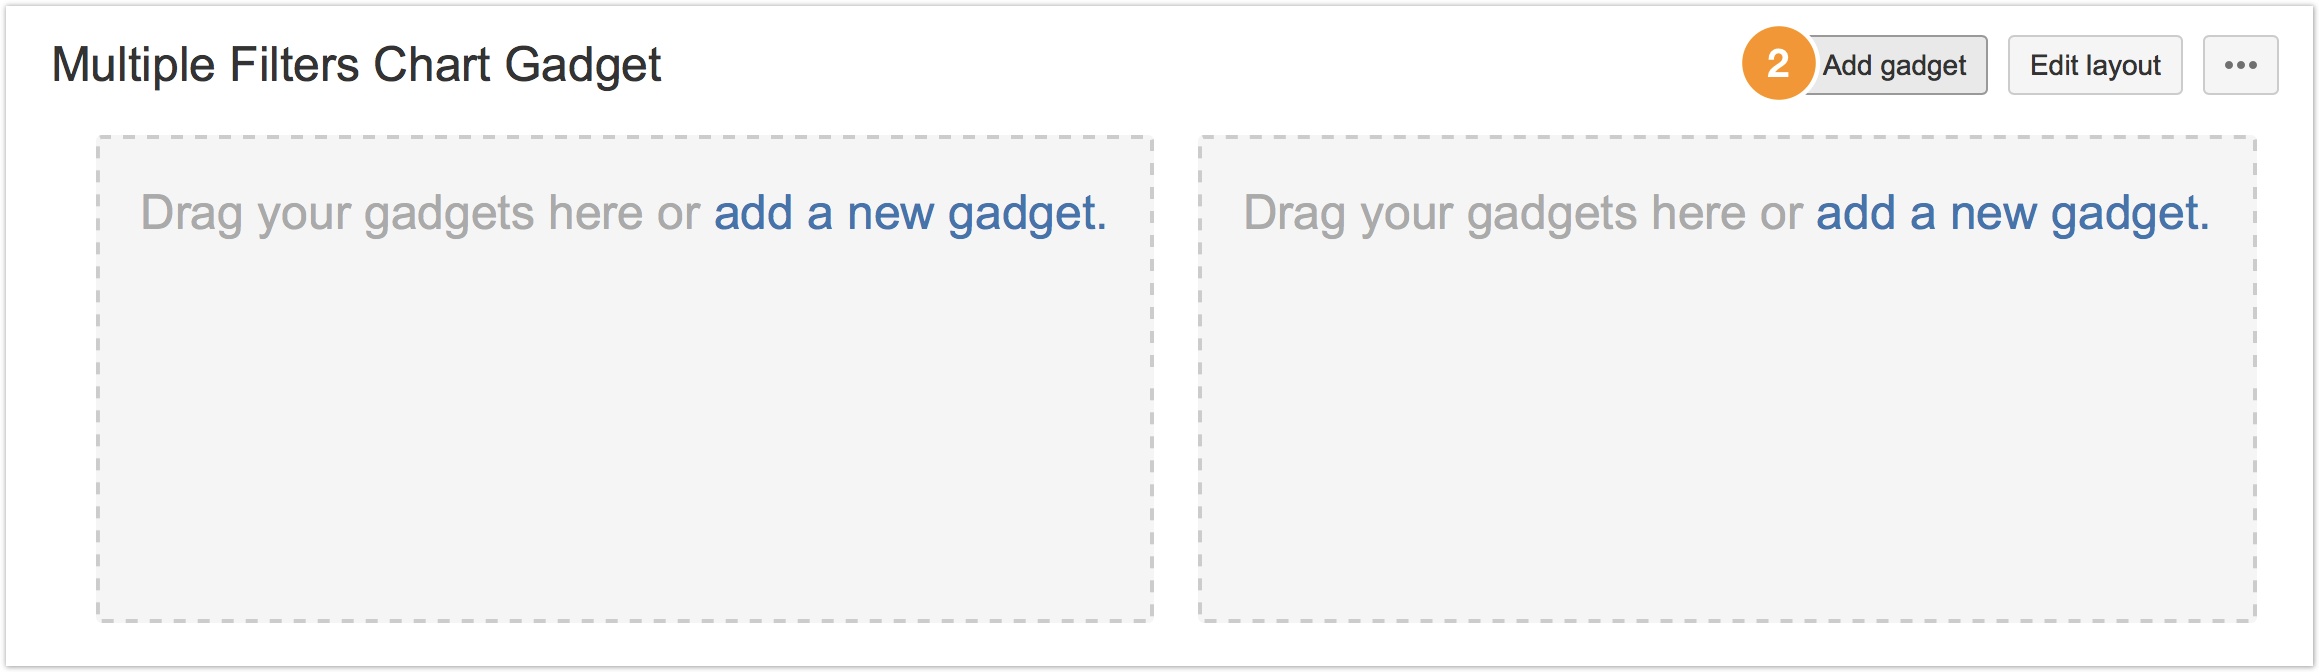
- When you are in the dashboard, click Add gadget on the top right hand corner of the screen.
- You should see a dialog with all the available gadgets.
If not, please click Load all gadgets.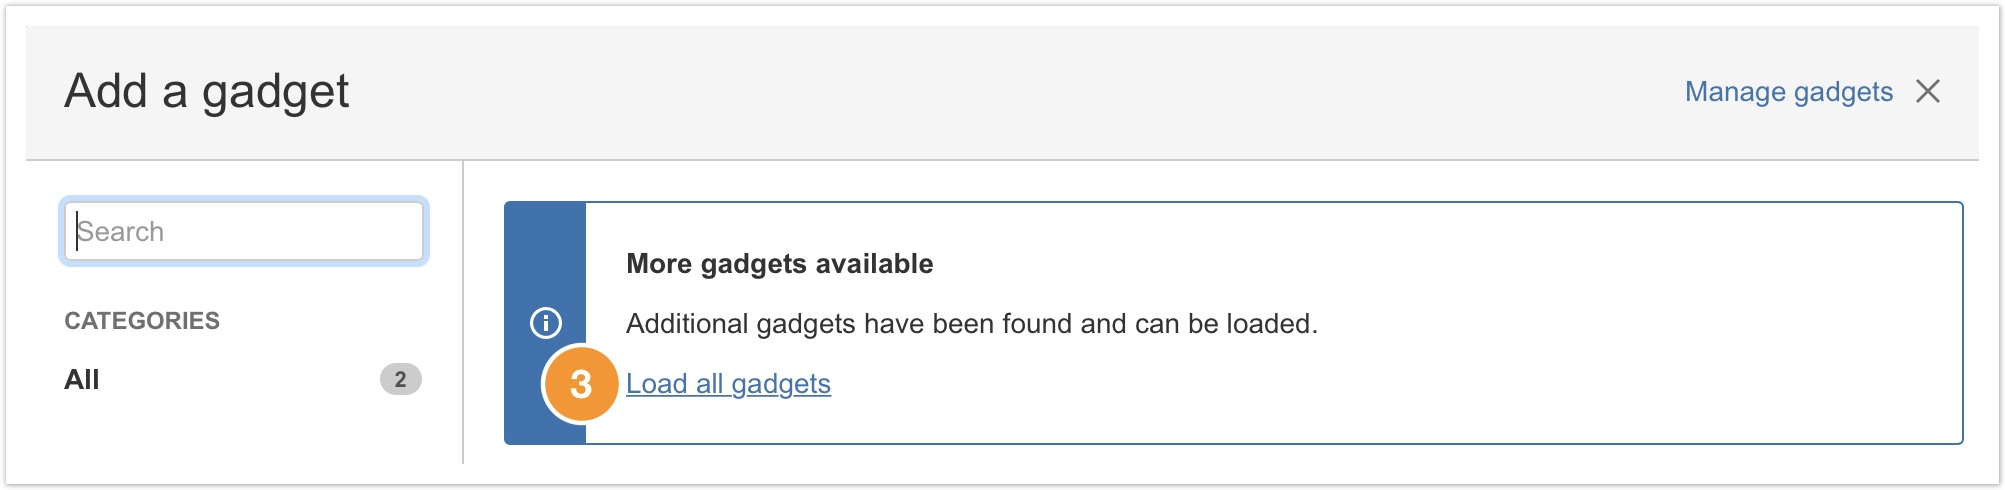
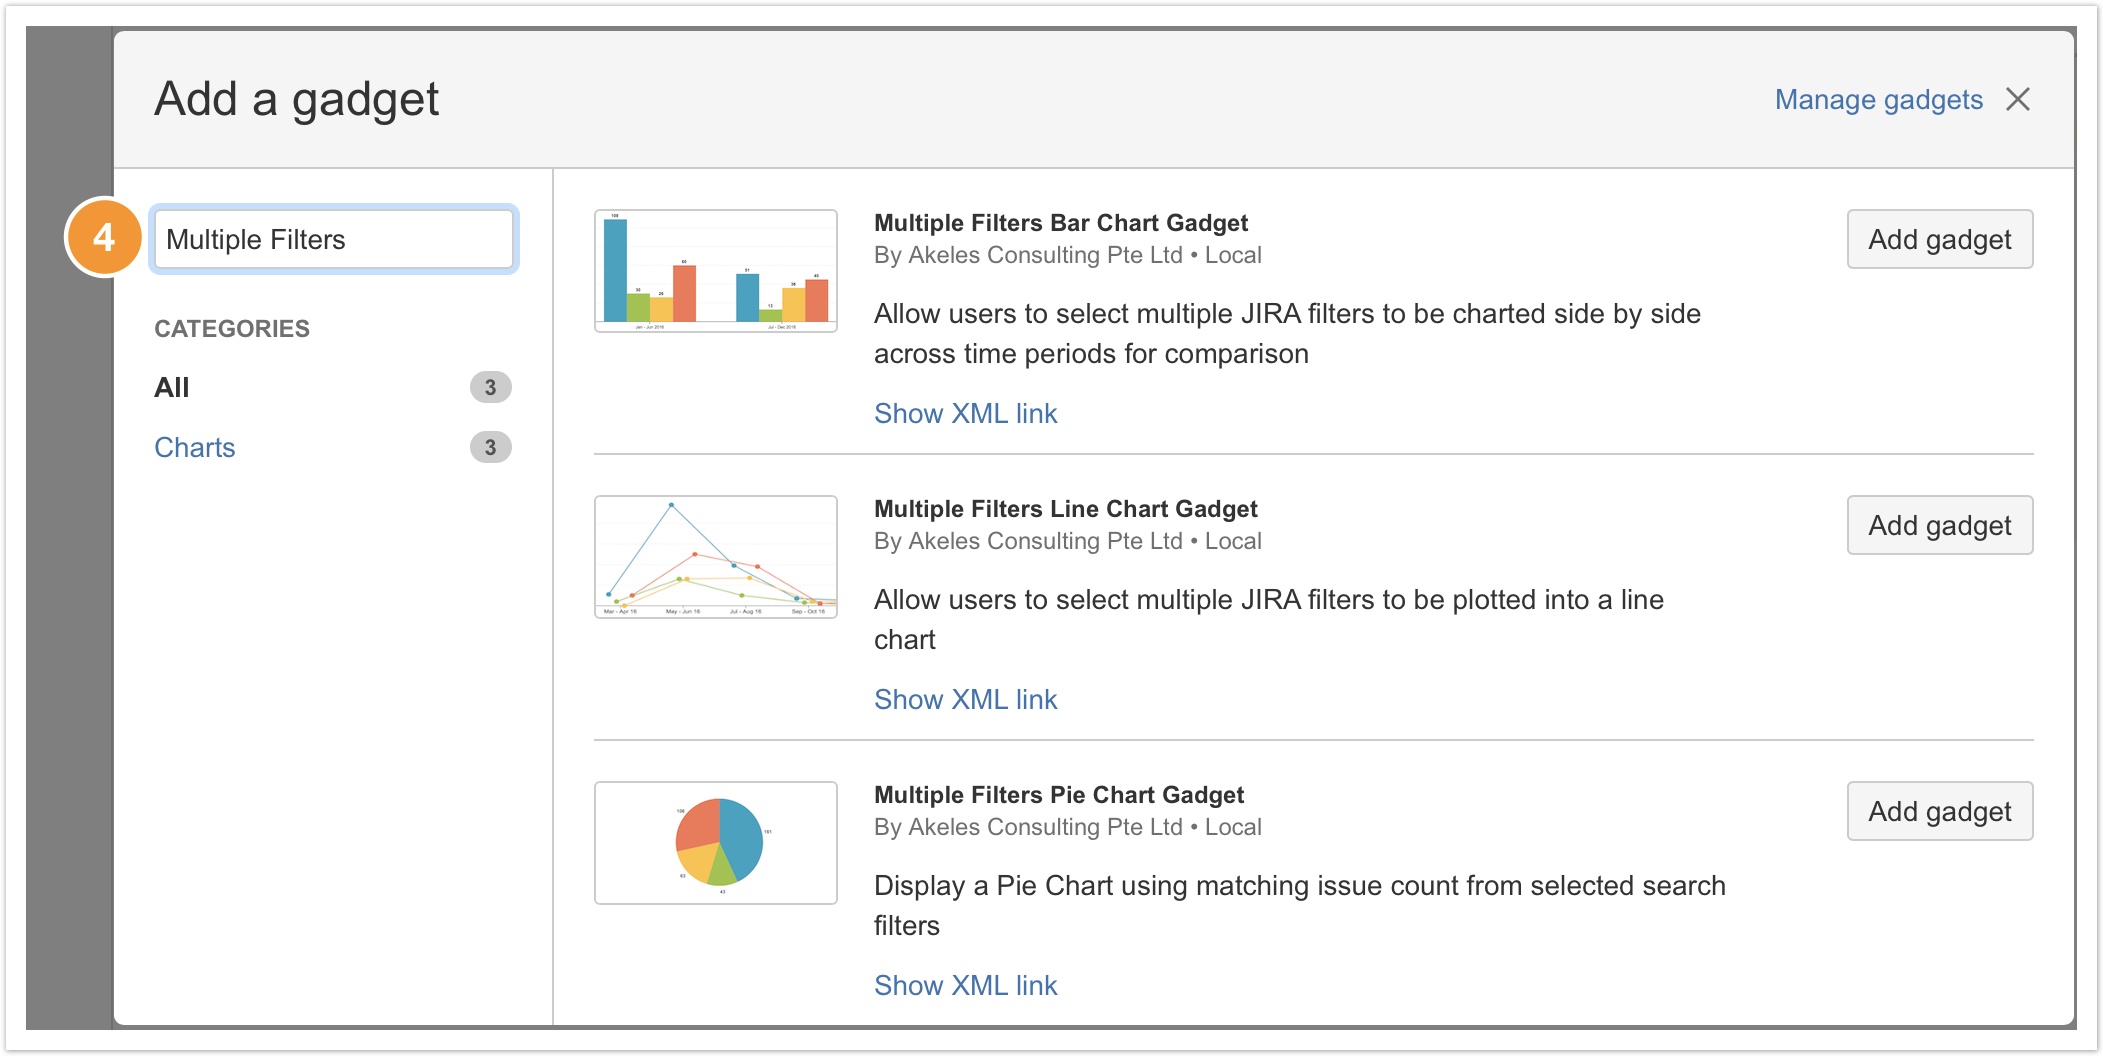
- Next, search for Multiple Filters or scroll through the list of gadgets to find your desired chart gadget.
There are 3 types of multiple filters chart gadgets available:- Multiple Filters Bar Chart Gadget
- Multiple Filters Pie Chart Gadget
- Multiple Filters Line Chart Gadget
Now, you are ready to configure the gadget.
Multiple Filters Bar Chart Gadget
Settings Default Value Explanation Title Enter title for the bar chart window. Date Field Select the Issue Field (of Date Type) to plot as the X-axis of the bar chart. Add Filter
Click to add another filter. Delete Last Filter
Click to delete the last filter. Filter n Choose the filter(s) that you want to display in the bar chart. Alias for Filter n Define an alias for the filter(s) to be displayed in the legend.
If undefined, filter name will be displayed.
Display all months No Choose whether to display all months in the chart regardless of the value (no. of records/issues):
- Yes (All months will be displayed, even if no. of records is 0)
- No (Only months with with at least 1 record will be displayed)
Months in Group 1 Choose the number of months to be grouped together:
- 1
- 2
- 3
- 4
- 6
- 12
- All Time
Display Full Year No Choose the display format of the Year:
- Yes (E.g. Year 2016 will be displayed as "2016")
- No (E.g. Year 2016 will be displayed as "16")
Display Type Bar Chart Only Choose the display type of the gadget:
- Bar Chart Only
- Data Table Only
- Bar Chart and Data Table
Calculation Mode Issue Count Choose whether to display the sum of issue count or selected custom field values:
- Issue Count
- Selected Custom Field Values
Hide Data Labels Yes Choose whether to display or hide the value:
- Yes
- No
Color Scheme Basic Choose a color scheme:
- Basic
- Contrasting
- Shades
- Warm
Display Mode Grouped Choose how the bars should be displayed:
- Grouped
- Stacked
Refresh Interval Never Select how often (how many minutes interval) the bar chart should be refreshed:
- Never
- Every 15 minutes
- Every 30 Minutes
- Every 1 hour
- Every 2 hours
Multiple Filters Pie Chart Gadget
Settings Default Value Explanation Title Enter title for the pie chart window. Add Filter
Click to add another filter. Delete Last Filter
Click to delete the last filter. Filter n (max. 12) Choose the filter(s) that you want to display in the pie chart. Alias for Filter n Define an alias for the filter(s) to be displayed in the legend.
If undefined, filter name will be displayed.
Value Type Issue Count Choose the value type to be displayed:
- Issue Count
- Percentage
Hide Data Labels Yes Choose whether to display or hide the value:
- Yes
- No
Color Scheme Basic Choose a color scheme:
- Basic
- Contrasting
- Shades
- Warm
Refresh Interval Never Select how often (how many minutes interval) the pie chart should be refreshed:
- Never
- Every 15 minutes
- Every 30 Minutes
- Every 1 hour
- Every 2 hours
Multiple Filters Line Chart Gadget
Settings Default Value Explanation Title Enter title for the pie chart window. Date Field Select the Issue Field (of Date Type) to plot as the X-axis of the line chart. Add Filter
Click to add another filter. Delete Last Filter
Click to delete the last filter. Filter n (max. 12) Choose the filter(s) that you want to display in the pie chart. Alias for Filter n Define an alias for the filter(s) to be displayed in the legend.
If undefined, filter name will be displayed.
Display All Months No Choose whether to display all months in the chart regardless of the value (no. of records/issues):
- Yes (All months will be displayed, even if no. of records is 0)
- No (Only months with with at least 1 record will be displayed)
Months In Group 1 Choose the number of months to be grouped together:
- 1
- 2
- 3
- 4
- 6
- 12
Display Full Year No Choose the display format of the Year:
- Yes (E.g. Year 2016 will be displayed as "2016")
- No (E.g. Year 2016 will be displayed as "16")
Display Type Line Chart Only Choose the display type of the gadget:
- Line Chart Only
- Data Table Only
- Line Chart and Data Table
Calculation Mode Issue Count Choose whether to display the sum of issue count or selected custom field values:
- Issue Count
- Selected Custom Field Values
Hide Data Labels Yes Choose whether to display or hide the value:
- Yes
- No
Color Scheme Basic Choose a color scheme:
- Basic
- Contrasting
- Shades
- Warm
Refresh Interval Never Select how often (how many minutes interval) the line chart should be refreshed:
- Never
- Every 15 minutes
- Every 30 Minutes
- Every 1 hour
- Every 2 hours

Manage space
Manage content
Integrations