Summary
| Table of Contents | ||
|---|---|---|
|
New features
Show/Hide filters on click
| Note |
|---|
Applicable for Line charts only. |
You can now show/hide filters by clicking on the colored box in legend of the filter.
The link in the legend will still redirect to display the list of issues for that filter.
...
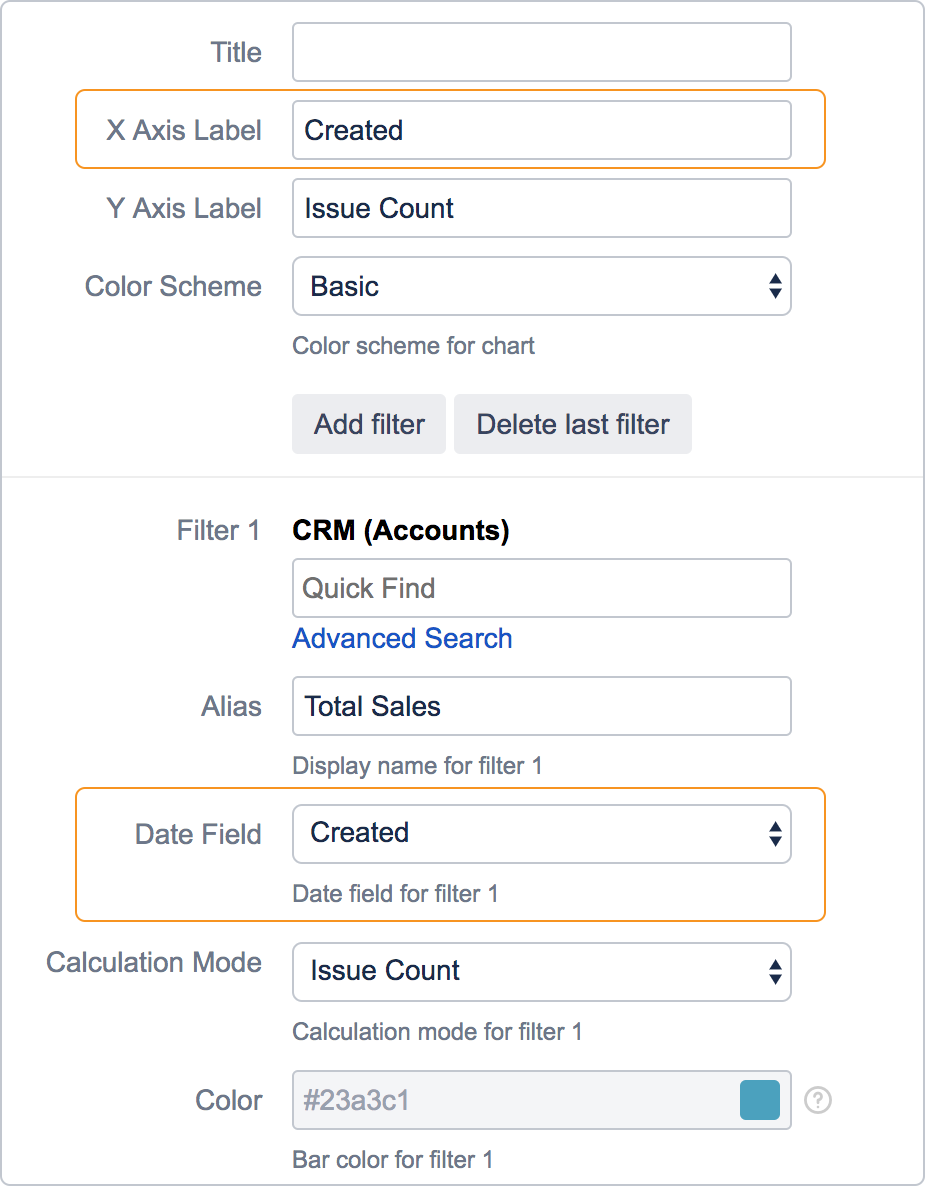
For each filter added, you can now select a date field to be used for the x-axis.
The Date Field has been changed to X Axis Label, and default value will be the selected date field for Filter 1.

Interpolation
| Note |
|---|
Applicable for Line charts only. |
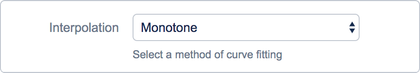
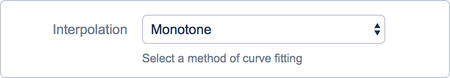
You can now choose from 2 methods of interpolation, which affects how the line is drawn:
- Linear (Default)
- Monotone
Tick Interval
| Note |
|---|
Applicable for Bar and Line charts only. |
...