| Info |
|---|
This is only available from version 4.1.0/5.1.0 onwards. |

Settings | Default | Description | |
|---|---|---|---|
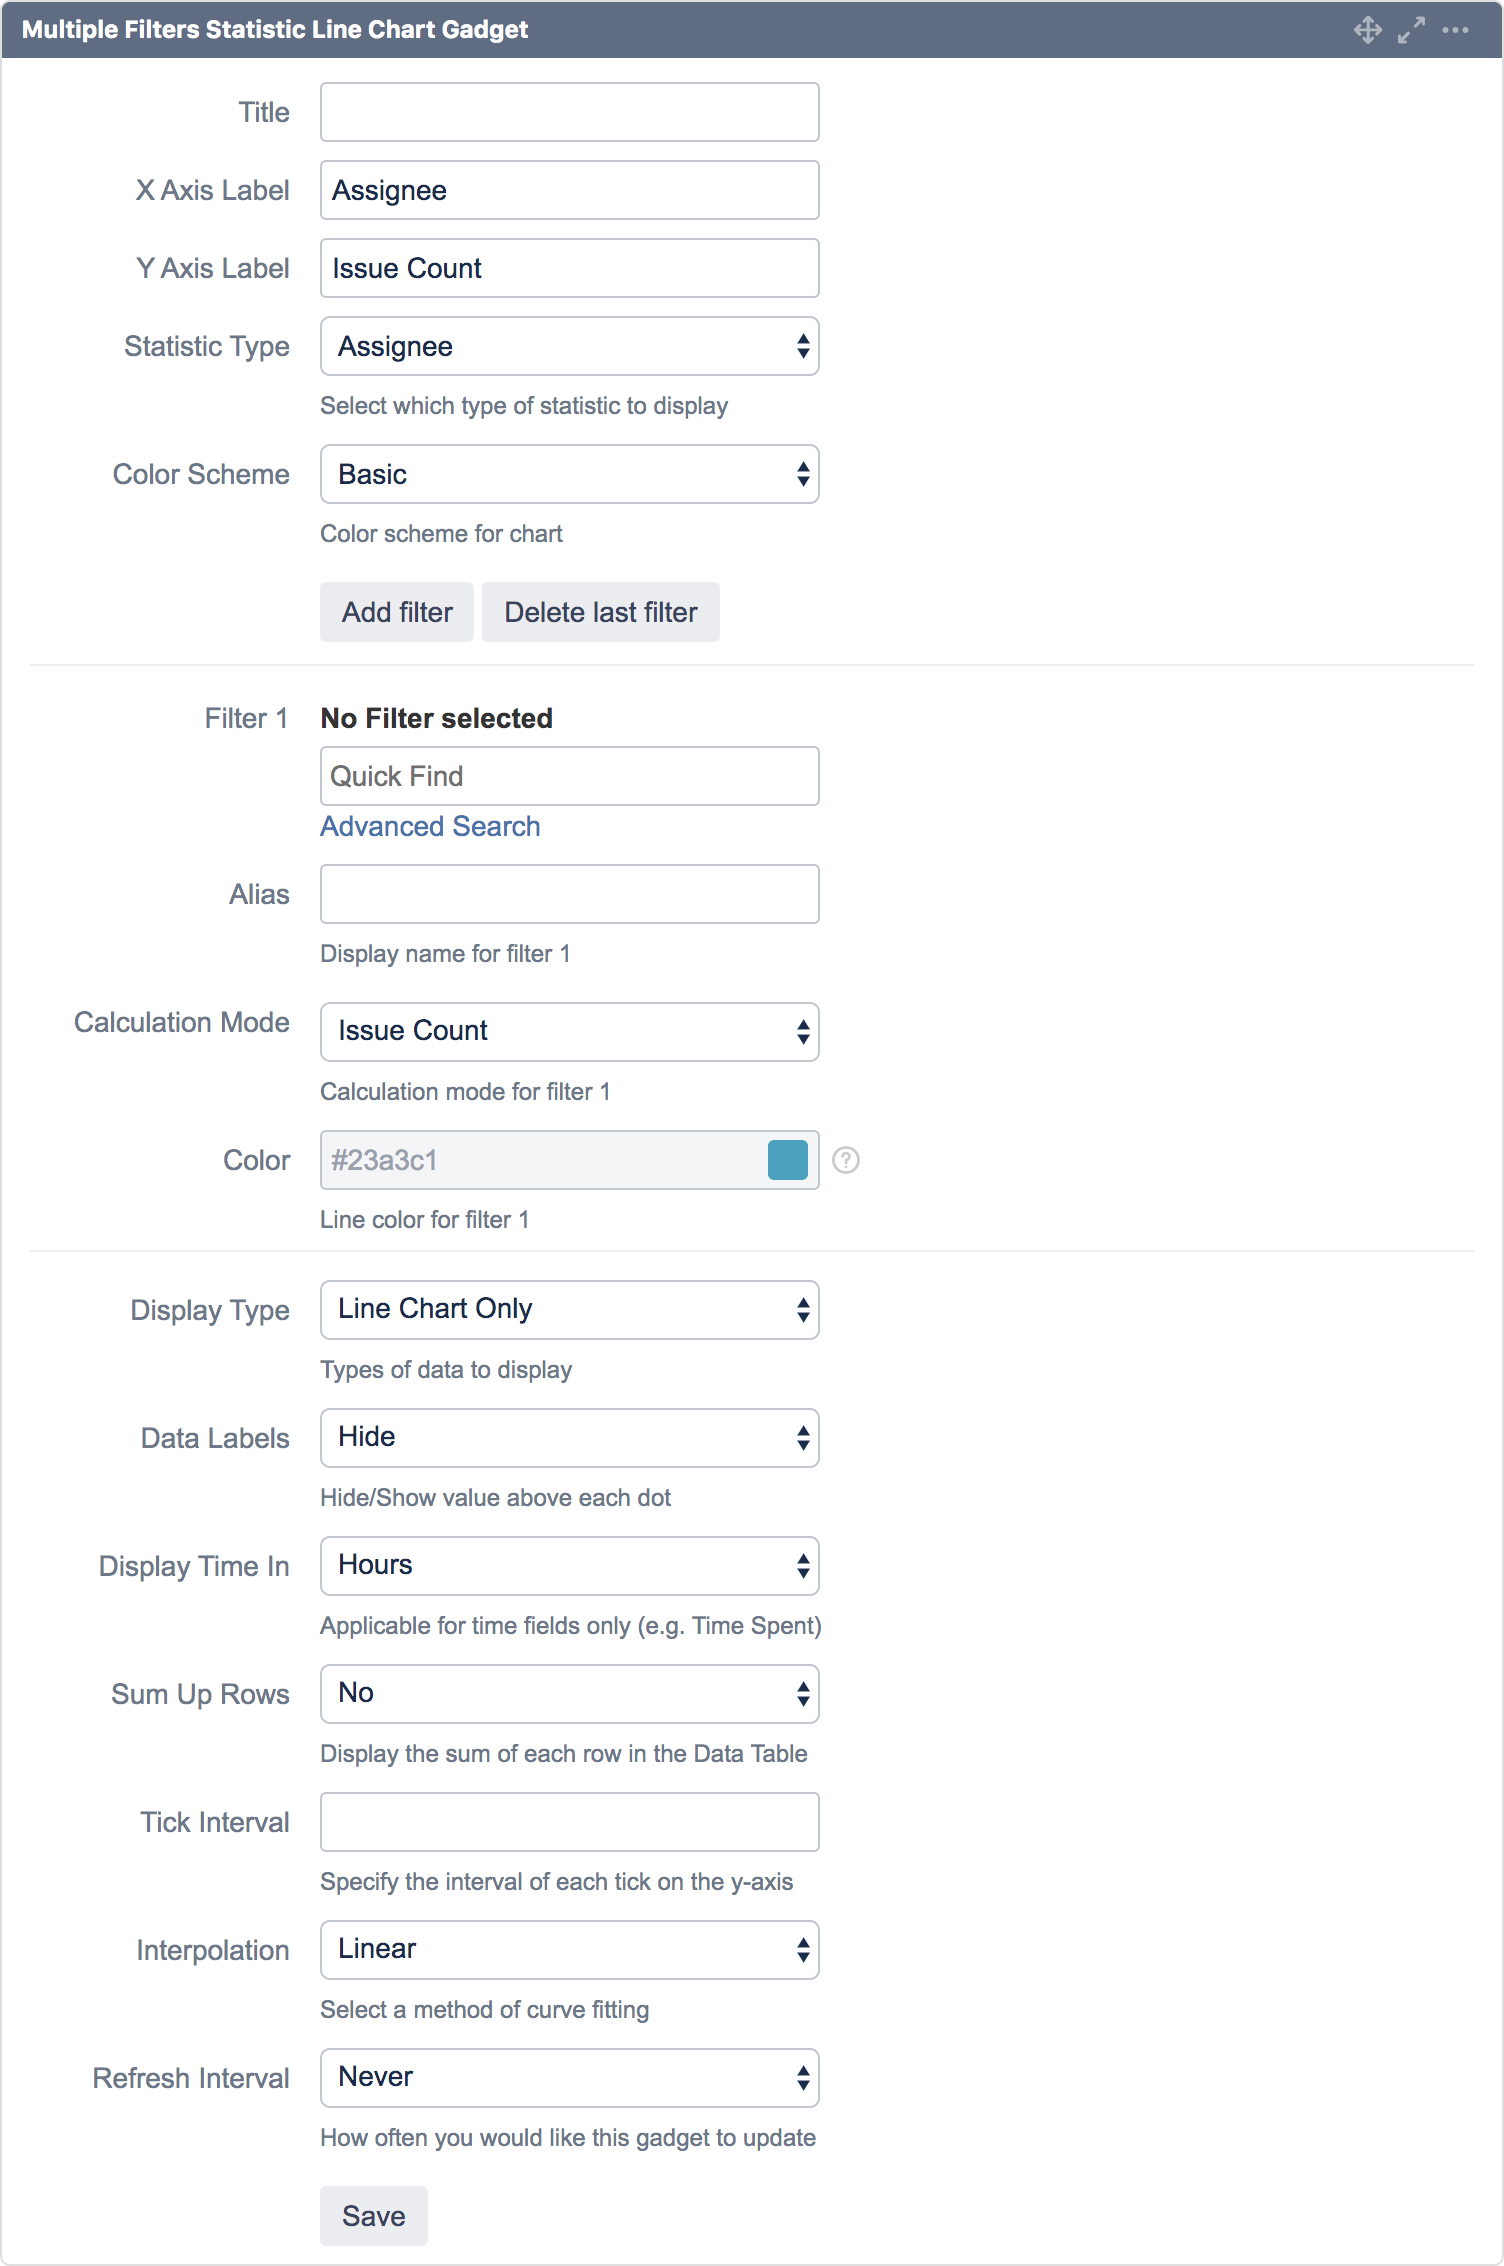
Title | Title of the gadget. | ||
X Axis Label | Assignee | Label for x-axis. | |
Y Axis Label | Issue Count | Label for y-axis. | |
Statistic Type | Assignee | The statistic type used to plot the line chart. | |
Color Scheme | Basic | The color scheme of the line chart. | |
Add Filter | Click to add another filter. *Maximum of 12 filters | ||
Delete Last Filter | Click to delete the last filter. | ||
Filter n | The filter used to plot the line chart. | ||
Alias n | The display name for the selected filter. If undefined, the filter name will be used. | ||
Calculation Mode n | The calculation mode:
| The calculation operator:
*Not applicable for Issue Count and Same as Filter 1 calculation mode. | |
Color n | The color for the selected filter’s line. *Configurable only if Color Scheme is set to Custom. | ||
Display Type | The display type of the gadget:
| ||
Data Labels | The data labels of each bar:
| ||
Display Time In | To display time in:
*Applicable for Time Fields only. | ||
Sum Up Rows | To sum up rows in the Data Table:
*Applicable if Data Table is displayed. | ||
Tick Interval | The interval of each tick on the y-axis. | ||
Interpolation | Linear | The method of interpolation for the line:
| |