| Settings | Default Value | ExplanationDescription | ||||
|---|---|---|---|---|---|---|
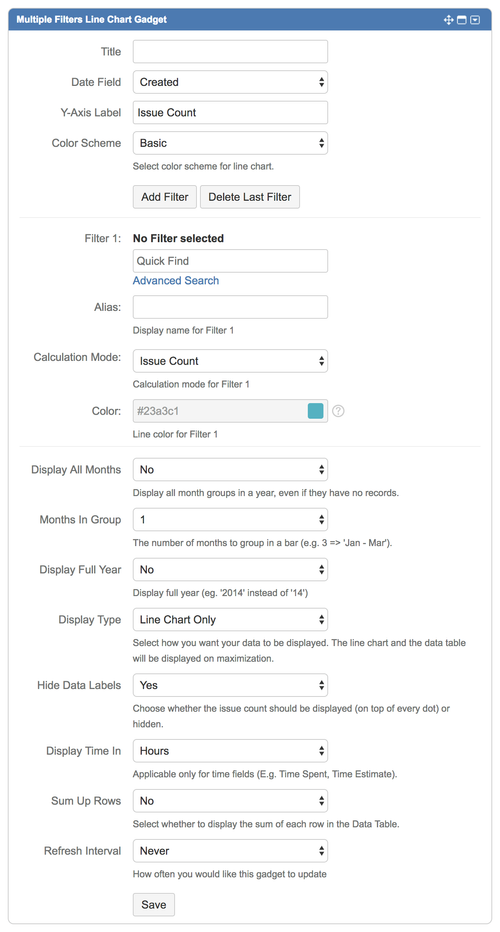
| Title | Enter title for the line chart windowgadget. | |||||
| Date Field | Created | Select the Issue Field (of Date Type)date field to plot as the Xx-axis of the line chart.bar chart:
| ||||
| Y-Axis Label | Issue Count | Define the Yy-axis label to be displayed. | ||||
| Color Scheme | Basic |
Select a color scheme for the line chart:
| ||||
Add Filter | Click to add another filter. *Maximum of 12 filters can be added. | |||||
Delete Last Filter | Click to delete the last filter. | |||||
| Filter n (max. 12) | Choose the filter(s) to be displayed in plot the line chart. | |||||
| Alias for Filter n | Define an alias for the filter(s) to be displayed in the legend. If undefined, filter name will be displayed. | |||||
| Calculation Mode for Filter n | Issue Count | Select the calculation mode:
| Select the calculation operator:
*Not applicable for Issue Count and Same as Filter 1 option. | |||
| Color for Filter n |
Pick a color for the line. *Configurable only if Color Scheme is set to Custom. | |||||
| Display All Months | No | Select whether to display all months in the chart regardless of the value (no. of records/issues):
| ||||
| Months In Group | 1 | Select the number of months to be grouped together:
E.g. If 4 is chosen, grouping will be 4 months in group: Jan ― Apr, May ― Aug, Sep ― Dec. | ||||
| Display Full Year | No | Select the whether to display format of the Yearfull year:
| ||||
| Display Type | Line Chart Only | Select the display type of the gadget:
| ||||
| Hide Data Labels | Yes | Select whether to display or hide the values:
| ||||
| Display Time In | Hours | Select how the time should be displayed:
*Applicable for Time Fields only. | ||||
| Sum Up Rows | No |
Select whether to display the sum of each row sum up rows in the Data Table:
*Applicable only if Data Table is displayed. | ||||
| Refresh Interval | NeverChart Mode | Normal |
Select how often (how many minutes interval) the line chart data should be refreshedcalculated over time:
| |||