...
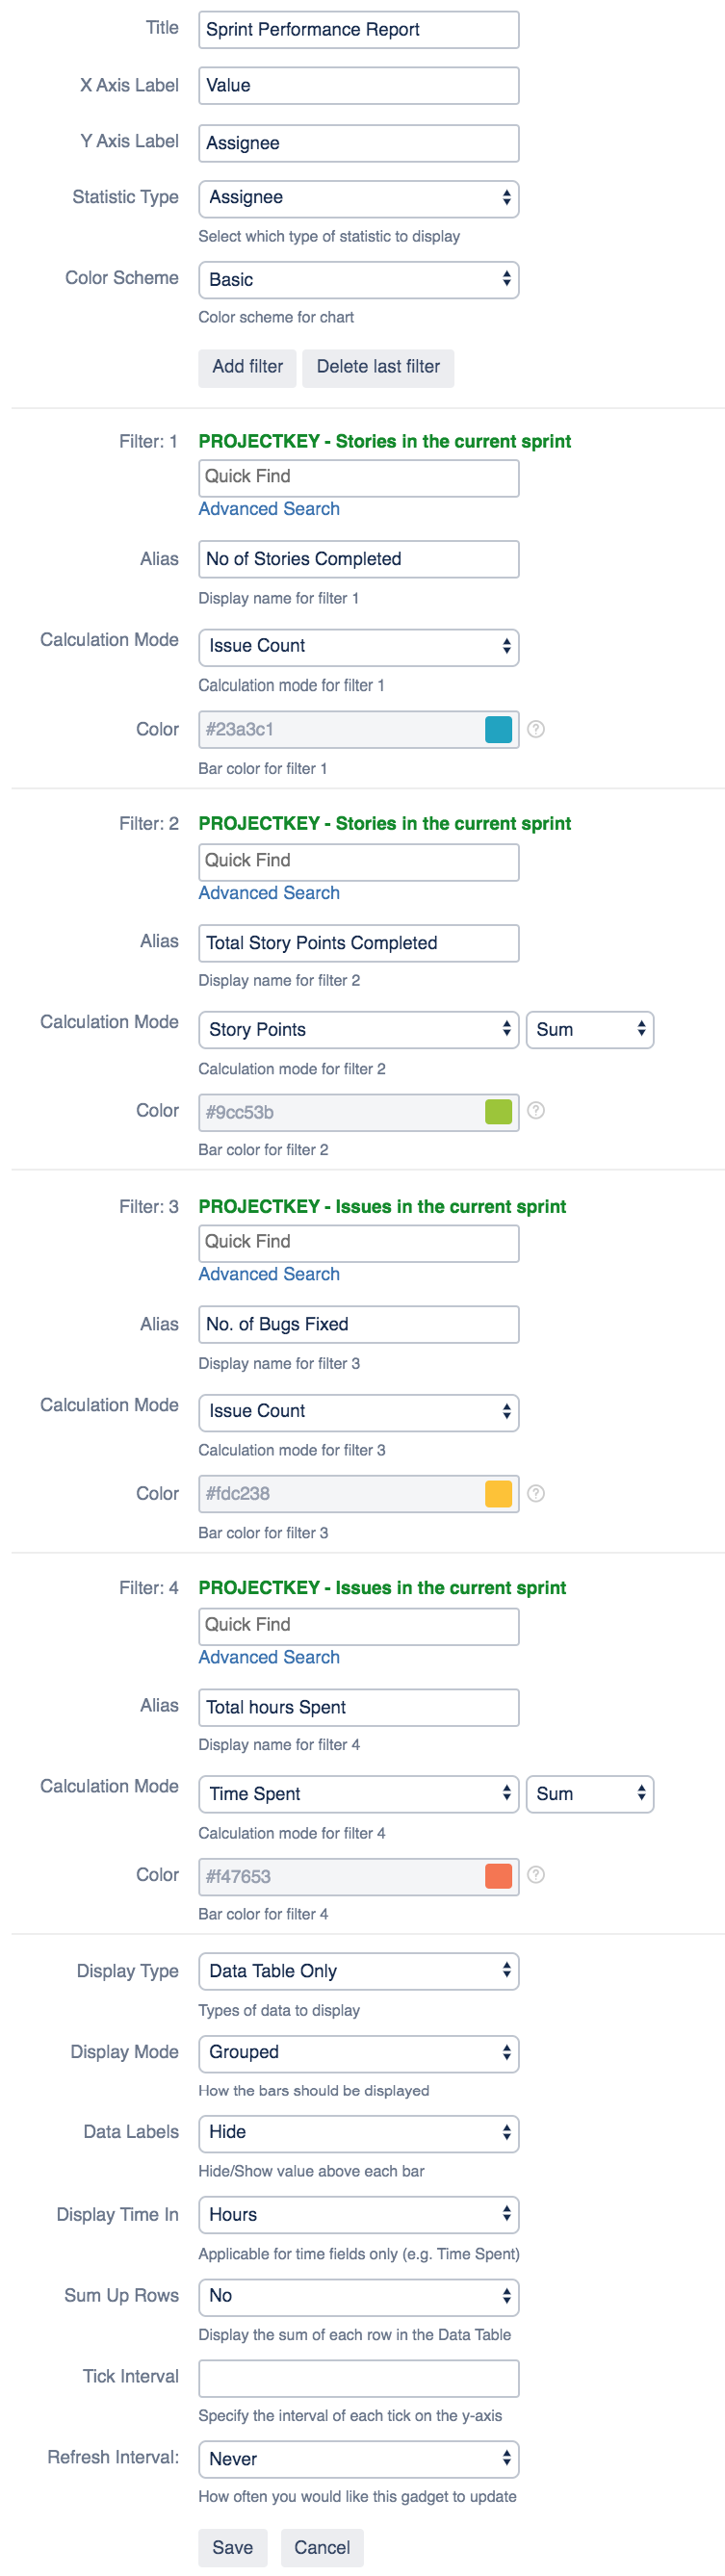
| Column | Filter Name | Filter JQL | ||
|---|---|---|---|---|
No of Stories Completed | PROJECTKEY - Stories in the current sprint |
| ||
| Total Story Points Completed | Can reuse the previous filter | |||
| No. of Bugs CompletedFixed | PROJECTKEY - Issues in the current sprint |
| ||
| Total hours Spent | PROJECTKEY - Issues in the current sprint |
|
...
- Add a Multiple Filters Statistic Bar Chart Gadget (Horizontal) gadget in the dashboard
- Add the 4 filters defined defined above
- For the 2nd filter to display the Total Story Points Completed, you can choose to Sum by Story Points instead of the default issue count
- For the 4th filter to display the Total hours Spent, you can choose to Sum by Time Spent
- You can choose to hide or display the horizontal chart